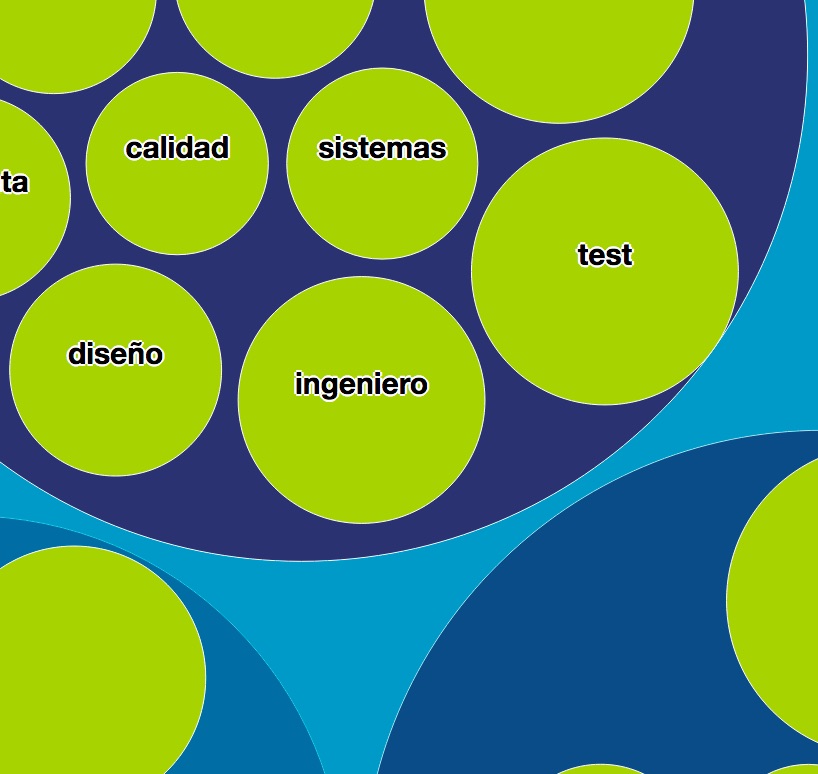
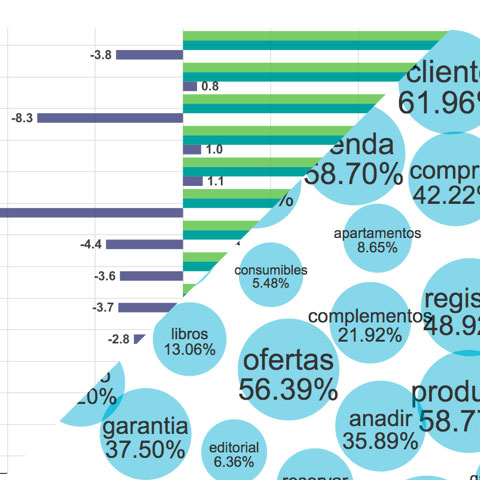
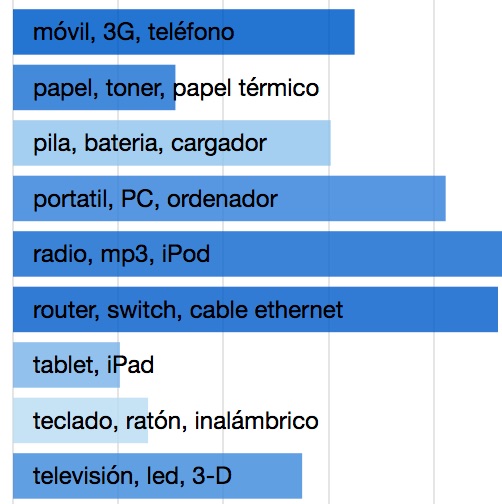
Now that Big Data technologies have enabled the processing of huge amounts of data, the next step is to present the processed data in a clear and efficient way. Being aware of this necessity, the ML4DS group has integrated machine learning based data analysis with interactive visualization tools. This new way of accessing the information combines technologies such as D3, dc.js or crossfilter.js with HTML5 templates to create web applications that ease and improve data analysis for the final user.


Data visualization
